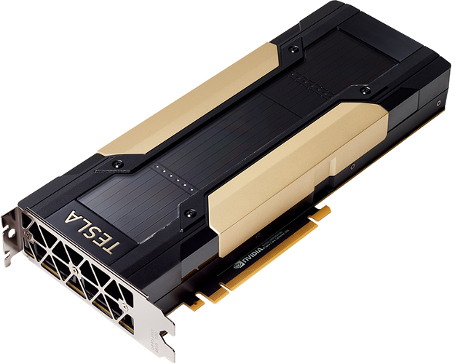
Enter Nvidia with its flagship V100 GPU (Volta architecture). With 50% more flops, 20% higher memory bandwidth, and vastly increased cache size compared to the previous generation P100 (Pascal), it boasts impressive specifications. The highest-end version features 32 GB of memory on the card – enabling a wide range of applications. Nvidia’s impressive DGX server stacks up 16 of these V100 into a single unified system, unleashing tremendous compute power.
While the current hype and atttention is clearly around Deep Learning and Artifical Intelligence, in this post we compare both top of the line processors from the competing vendors on traditional High Performance Computing workloads. Those applications are still – to a very large extent – dominating the data centers in various industries. In the following, we are putting both processors to the test on selected applications from the Xcelerit Quant Benchmarks.

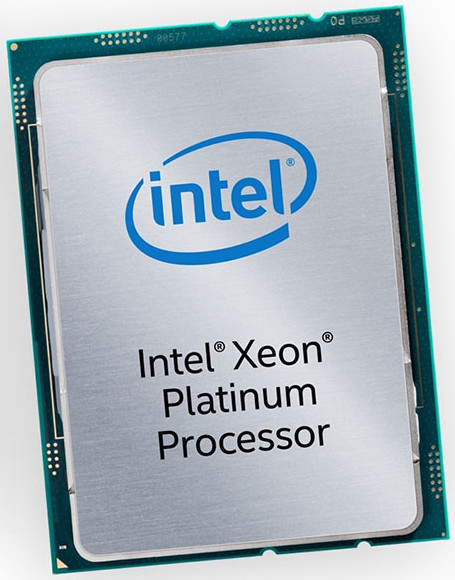
Intel Xeon Scalable Platinum

Nvidia Tesla V100 GPU
Hardware Comparison
The table below shows the key hardware differences between the two processors.
| Processor | Cores | Logical Cores | Frequency | GFLOPs (double)1 | Cache | Max. Memory | Memory B/W |
|---|---|---|---|---|---|---|---|
| Intel Xeon Platinum 8180 | 28 | 56 (HT) | 2.5 GHz | 2,240 GFLOPs | 38.5MB L3 + 28MB L2 | 768 GB | 119.2 GB/s |
| Nvidia V100 PCIe (Volta) | 80 | 5,120 (CUDA Cores) | 1.53 GHz | 7,014 GFLOPs | 6 MB L2 | 16 GB | 900 GB/s |
1Note that the FLOPs are calculated by assuming purely fused multiply-add (FMA) instructions and counting those as 2 operations (even though they map to just a single processor instruction). Full SIMD instructions are assumed on the Platinum CPU.
Xcelerit Quant Benchmark
The peak GFLOPs given above are rarely reached in real-world applications. Beyond compute instructions, many other factors influence performance, such as memory and cache latencies, thread synchronisation, instruction-level parallelism, and branch divergance. To give an indication of the performance in the real world, we use selected applications form the Xcelerit Quant Benchmarks, a representative set of applications widely used in Quantitative Finance. Those applications have been hand-tuned for maximum performance using a native implementation by code optimisation experts, often in collaboration with the relevant processor maker.
| Financial Instrument | Numerical Method | Description | Parameters |
|---|---|---|---|
| LIBOR Swaption Portfolio | Monte-Carlo | Prices a portfolio of LIBOR swaptions on a LIBOR Market Model and computes sensitivities |
|
| American Options | Binomial Lattice | Prices a batch of American call options under the Black-Scholes model using a Binomial lattice (Cox, Ross and Rubenstein method). (read more) |
|
| European Options | Closed form | Prices a batch of European call and put options the Black-Scholes-Merton formula. We repeat the formula 100 times to increase the overall runtime for performance measurements. (read more) |
|
| Barrier Options | Monte-Carlo | Prices a portfolio of up-and-in barrier options under the Black-Scholes model using a Monte-Carlo simulation. (read more) |
|
Selected Applications from the Xcelerit Quant Benchmarks
Benchmark Setup
We compare the performance of each application on the Skylake and Volta processors. The configuration for both systems is given below:
| Skylake System | Volta System | |
|---|---|---|
| CPU | 2 x Intel Xeon Platinum 8180 | 2 x Intel Xeon E5-2686 v4 |
| GPU | N/A | Nvidia Tesla V100 PCIe |
| OS | RedHat Enterprise Linux 7.3 | RedHat Enterprise Linux 7.4 |
| RAM | 192GB | 128GB |
| Compiler | Intel 2018 | CUDA 9.0, GCC 4.8 |
| ECC | on | on |
| Precision | double | double |
Performance
To measure the performance, the application is executed repeatedly, recording the wall-clock time for each run, until the estimated timing error is below a specified value. The measurement includes the full algorithm execution time from inputs to outputs. The speedup versus a sequential implementation on a single core of a Intel Xeon E5-2698 v3 processor is reported, averaged over varying numbers of paths or options:
We observe that the performance difference is variable between different real-world quantitative finance workloads. The high variation across applications can be explained by the different characteristics, in particular the relation of compute instructions to memory access operations, and the memory access patterns.
For the LIBOR swaption portfolio pricer, Skylake is 1.9x faster than the V100. This application benefits highly from the AVX-512 vector instructions, calculating 8 double-precision floating point operations in one instruction. Further, it uses several megabytes of memory per Monte-Carlo path, which happen to fit into the cache hierarchy of the Skylake system completely, while the registers and caches on the V100 are not sufficient to hold this data. These two factors give Skylake a significant advantage over the GPU, even though the raw GFLOP/s figures suggest otherwise.
The Binomial American option pricer is almost at par between the two processors – the V100 has a slight advantage of 1.06x. Here the effects of vectorisation and caching balance out with the raw compute power.
The Black-Scholes option pricer is compute-bound with few memory accesses. On the GPU all memory access are fully coalesced, reducing the observed memory latencies futher. This is why the V100 gives a 4.1x speedup over the Skylake in this application.
The Monte-Carlo barrier options application shows a large boost of 6.1x on the GPU over the Skylake CPU. On the GPU, this algorithm is highly compute-bound with all memory accesses fully coalesced and a high level of parallelism. This hides all memory access latencies. On the CPU, due to its lower number of registers and lower level of parallelism, the application is more memory-bound and therefore runs significantly slower.
Conclusion
While Nvidia’s top of the line GPUs are undisputedly dominating the deep learning and AI arena, the confrontation is far more balanced for traditional High Performance Computing workloads with Intel and Nvidia playing on the same league. Choosing which processor is best suited for a given task heavily depends on the workload itself and its characteristics – clearly, one processor does not fit all. The HPC race is still on!